By: Leah Shafer Glaser
The CDC has developed Leading Health Indicators (LHI) as part of Healthy People 2020, communicating high-priority health issues and actions that can be taken to address them. Their most recent infographic addresses Nutrition, Physical Activity, and Obesity. It’s a snapshot of progress toward targets — and a place to see where there’s still work to be done. Let’s take a look (full infographic at the bottom of this post).
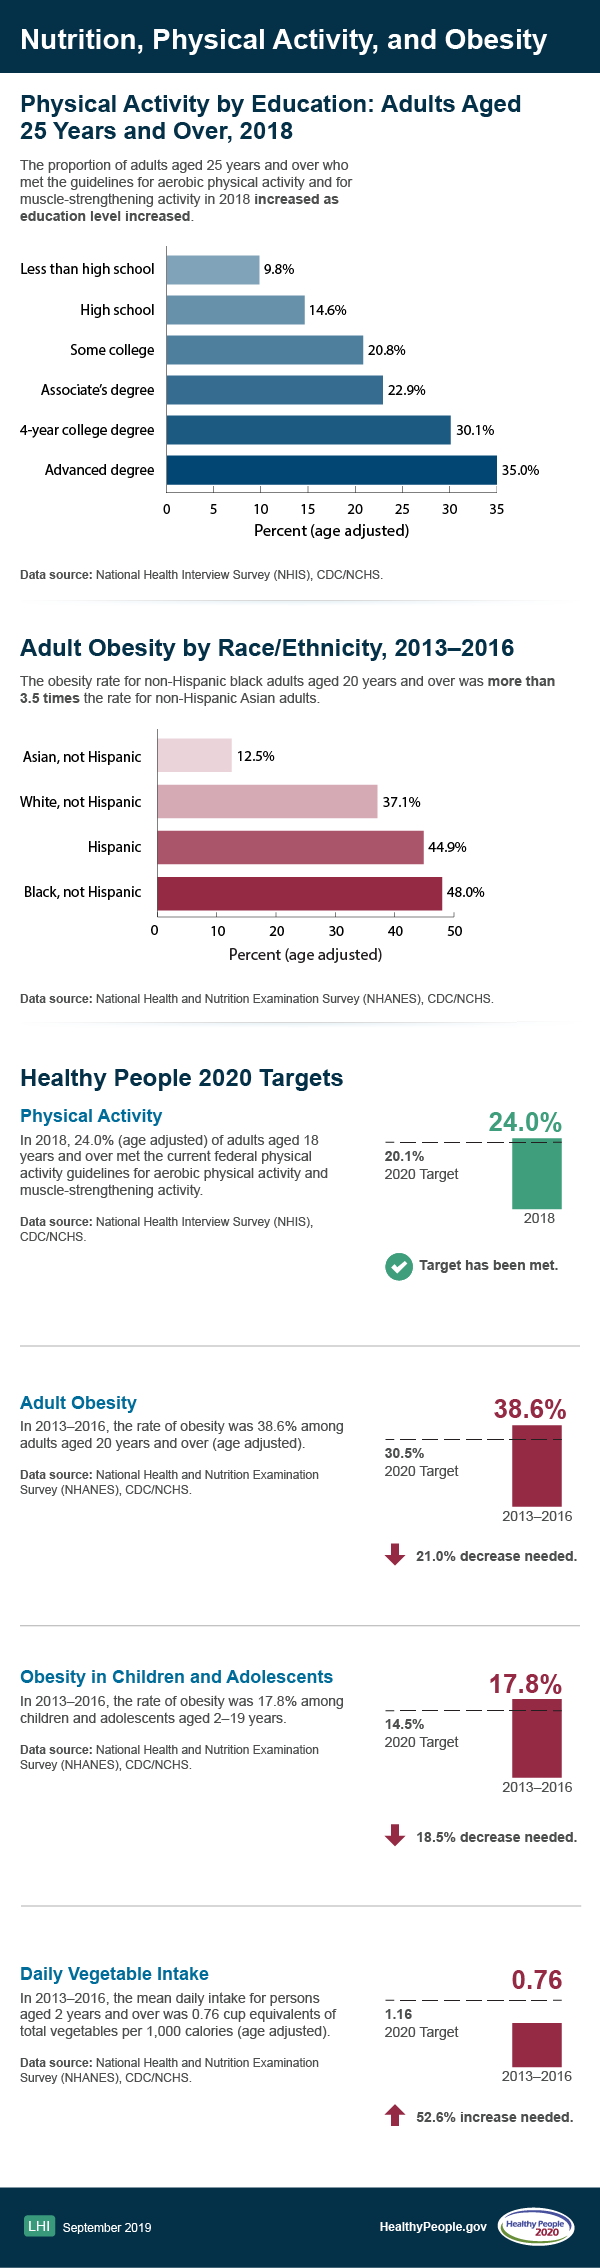
The first part of the infographic shows the relationship between educational levels and the proportion of adults over 25 who met the guidelines for aerobic activity and for muscle strengthening activity in 2018.
Second, the infographic breaks down rates of adult obesity by race/ethnicity from 2013 to 2016 across the United States. Among Asians, the rate was lowest, at 12.5%. White, not Hispanic, was 37.1%, Hispanic was 44.9%, and Black, not Hispanic, was 48%.
The CDC has Healthy People Targets as part of Healthy People 2020, and this part of the infographic looks at physical activity, where the target was met in 2018. During that year, 24% (age adjusted) of adults 18 years and over met the current federal physical activity guidelines and muscle strengthening activity.
The next part looks at adult obesity, where the goal was not met and a 21% decrease is needed. In 2013-2016 in adults aged 20 years and over (age adjusted), the obesity rate was 38.6%.
Among children and adolescents aged 2-19 years, in 2013-2019, the obesity rate was 17.8% An 18.5% decrease is needed to meet the Healthy People Target in this category.
Finally, the infographic looks at daily vegetable intake for persons aged 2 and over, where a 52.6% increase is needed to meet the Healthy People Target. The mean daily intake was 0.76 cup equivalents of total vegetables per 1,000 calories (age adjusted).
About the CDC Leading Health Indicators
The Leading Health Indicators are a subset of 26 Healthy People 2020 objectives that communicate high-priority health issues. These indicators can help assess the health of the Nation, encourage collaboration across sectors, and motivate action to improve the health of the U.S. population at the national, state, and community levels.