By Emily Gunderson
Evidence-based planning leads to research-based solutions. In today’s data-driven world, making informed decisions is crucial for both individuals and organizations, like local, state, and federal government organizations. Fortunately, there are multiple resources that can assist with data-gathering that support sound decisions based on research. In this blog post, we will discuss some of the resources available for accessing data that can help with decision-making.
County & State Open Data Portals
County and state open data portals are great resources for accessing data about local communities. These portals provide access to a wide range of information, including demographic data, transportation data, economic data, and more. Texas A&M University and the University of Texas libraries have published guides on where to access spatial data. These entities provide tips on navigating the sources and importing large datasets into the GIS applications. It may be valuable to look into multiple sources and various local, state, and federal level agencies. The Texas A&M University guide and the University of Texas guide both provide information on where to find data on GIS applications.
Texas A&M University Guide: https://tamu.libguides.com/gisdata
University of Texas Guide: https://guides.lib.utexas.edu/sources-of-geospatial-data/texas-gis-data
OnTheMap
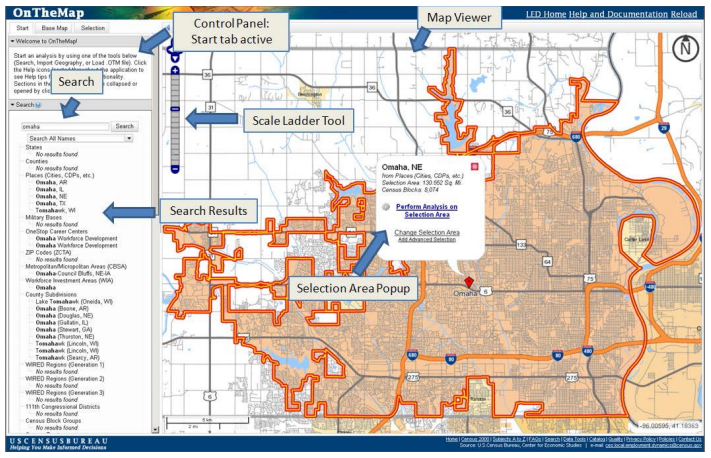
OnTheMap is a web-based mapping and reporting application from the US Census Bureau. The application shows where workers are employed and where they live. It also provides companion reports on age, earnings, industry distributions, race, ethnicity, educational attainment, and sex. OnTheMap can be used to measure the inflow/outflow of workers to your city, as well as, answer questions like:
- Where do young workers live who are employed in a city?
- Where are the workplace destinations for workers living in a particular city?
- How do specific employment areas compare in terms of worker origin patterns, worker ages, monthly earnings, and industry-sector employment? How are these areas changing over time and among different demographics?
- What percentage of high-wage workers live and work within a city, versus those who commute to a nearby city?
- How many workers that earn more than $3,333 a month live along a transit corridor and work downtown or in some other area along the same corridor?
- How many potential customers/employees live or work near a candidate site location?
Getting started with OnTheMap: https://www.oregon.gov/ohcs/data-research/Documents/rental-housing/getting-started-with-onthemap.pdf
OnTheMap: https://onthemap.ces.census.gov/
Social Explorer
Social Explorer is a paid resource that offers a seven-day free trial. The software derives baseline data from the US Census and is used to visualize and interact with data, create maps, charts, reports, and downloads. The site has hundreds of thousands of built-in data indicators related to demography, economy, health, politics, environment, crime, and more. Your own data can also be added to the platform. Social Explorer can be used to turn location data into smarter decisions and better outcomes, analyze and understand the socioeconomic and demographic development of your city, and measure long-term impacts through scenario planning.
Social Explorer: https://www.socialexplorer.com/
ArcGIS Business Analyst
If you already have an Esri account, then look into the ArcGIS Business Analyst product for easy integration. This product helps you make smarter decisions for market planning, site selection, and customer segmentation by combining demographic, business, lifestyle, spending, and census data with map-based analytics. The software helps you identify underperforming markets, pinpoint the right growth sites, find where your target customers live, and share the analysis with infographic reports and dynamic presentations. Pricing depends on your organization’s existing license with Esri.
Climate and Economic Justice Screening Tool
The Climate and Economic Justice Screening Tool hosts an interactive digital map. The map highlights disadvantaged census tracts that are overburdened and underserved. Federally Recognized Tribes, including Alaska Native Villages, are also considered disadvantaged communities. This tool is a step in implementing President Biden’s Justice40 Initiative and ensuring that the benefits of Federal programs are reaching communities that are overburdened by pollution and historic underinvestment. The program will identify the percentile the census tract falls within as it relates to climate change, energy, healthy, housing, legacy pollution, transportation, water and wastewater, and workforce development.
The Trust for Public Land Parkserve
The platform reports the percentage of residents within a 10-minute walk of a park and breaks it down by demographics. TPL has a mapping application that maps where existing parks are located, where new parks could be built, and gain insight on park equity.
The Trust for Public Land Parkserve: https://www.tpl.org/parkserve
Mapping Inequality Project
The Mapping Inequality Project is another resource that can provide valuable data for decision-making. This project is a collaborative research project that examines the history of redlining in American cities. The project provides access to a wealth of historical data on race, ethnicity, income, and housing that can be used to inform decisions about community development, housing policy, and economic development.
Mapping Inequality Project: https://dsl.richmond.edu/panorama/redlining/
MAPPING ACCESS
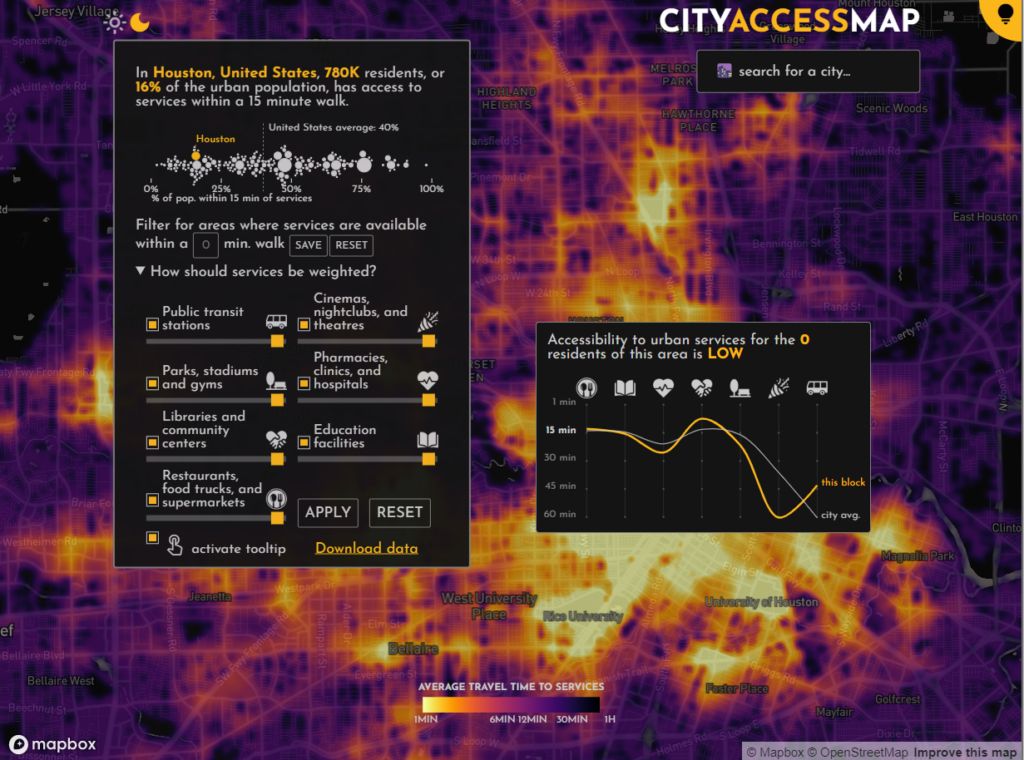
City Access Map
The City Access Map is an open-source app for global-scale urban accessibility insights. It was developed to provide public administrations, metropolitan authorities, municipalities, NGOs, private organizations, and residents, with the necessary tools to understand which cities are working to provide their residents with services that are accessible within a 15-minute walk vs those that need to invest in public infrastructure to improve access to services for their residents. As of early 2023, it covers (nearly) any urban area with more than 100,000 residents, worldwide, and computes walking accessibility down to the city block level, answering both macro-level and micro-level questions.
Other resources for locating datasets
Project Sidewalk: https://scistarter.org/project-sidewalk
Urban Data Catalog: https://datacatalog.urban.org/search/type/dataset
Urban & Regional Planning: https://guides.lib.umich.edu/c.php?g=282887&p=1885029